
This is a guest post from Dr. Brian Cohen, Senior Lecturer in the Department of Biological Sciences at Union College. Find him on Twitter @profbdcohen.
The cholesterol oxidase assay, part of kit 316- “In Search of the Cholesterol Gene” seemed like a perfect fit for my undergraduate upper level biochemistry lab. Part of the lecture material in the class includes transport of cholesterol in the body so a lab that taught students about how cholesterol is measured is useful for reinforcing the lecture material. However, I was interested in modifying the lab to introduce students to measuring products using a 96 well plate reader for several reasons including: 1) to give them experience with the instrument, 2) to allow them to have repeated measurements to see the accuracy of their pipetting to understand how that can introduce error, and 3) to teach them how to generate a standard curve with error bars using the standard deviation.
To modify the assay for a 96-well plate required adjusting the volumes of the samples and assay solution. An additional modification was made to make sure that the “unknowns” were within the range of the standard curve. Before lab students are asked to perform the calculations for the dilutions of the standard curve. This allows me to check their calculations and make any corrections before lab. Students are then given an aliquot of the 5.0 µg/µL stock solution and make the dilutions in water in 1.5 mL microcentrifuge tubes.
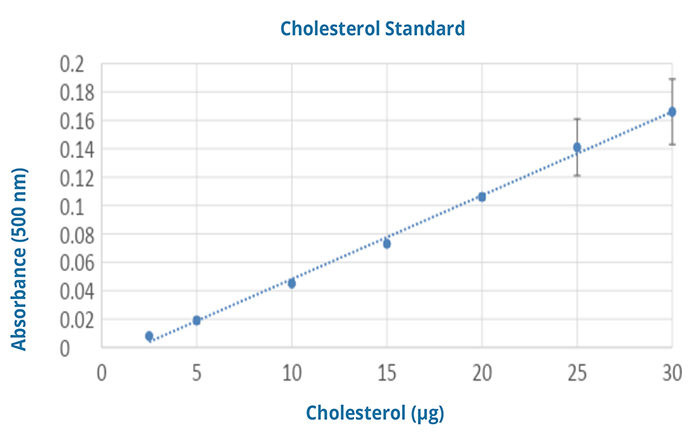
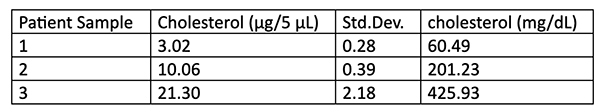
After making their dilutions, students pipette 20 µL of each standards or unknown into three wells each of a 96 well plate. Standards should be placed in the first 3 columns going from highest cholesterol to lowest. The sample without cholesterol should be used as a “blank” for the plate. The unknowns are then placed in the top rows of the next columns. They then use a multichannel pipettor to add 180 uL of assay solution into each well. The plate is then covered with plate sealing film and incubated for 15 minutes at 37oC. After the incubation period the plate is read at 500nm. Students are given the results of the measurement and asked to calculate the average and standard deviation for each standard and “unknown”. They then generate the standard curve and use the equation of the line to calculate the concentrations of the “unknowns”.
A few caveats:
- The ratio of sample to assay solution is 1:20 in the original lab but in this modified lab it’s 1:10. I found that this gave much more reliable and reproducible results than using 10 µL in a final volume of 200 µL.
- The concentration of the highest unknown was slightly higher than the highest concentration on the standard curve so I modified both the amount of cholesterol standard at the highest concentration and I diluted the original “unknowns” slightly to make sure they were all inside the top and bottom of the curve.
- The higher concentrations of the standard curve were slightly cloudy but this did not seem to affect the absorbance at 500nm.
- The color change is somewhere between very subtle and almost imperceptible by eye so qualitative observation is not possible.