

What is a Standard Curve?
A standard curve, in scientific experiments, is a graph that shows the relationship between known concentrations of a substance (usually plotted on the x-axis) and a measurable response (plotted on the y-axis) such as absorbance, fluorescence, or another signal in an assay. The curve is typically used to determine unknown concentrations of that substance in test samples by comparing their responses to this known range.
What are some examples of a Standard Curve in Science?
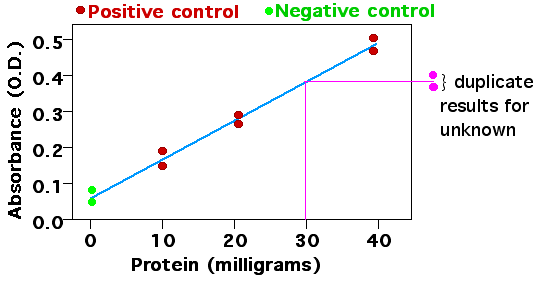
In biochemistry, protein quantification often uses assays like the Bradford or BCA (Bicinchoninic Acid) assay, where a color change occurs in response to the presence of proteins. Researchers prepare a standard curve using known concentrations of a protein (like bovine serum albumin, BSA). By measuring the absorbance at a specific wavelength for each concentration, they plot the standard curve. Unknown protein concentrations can then be determined by measuring their absorbance and locating where it falls on the curve.
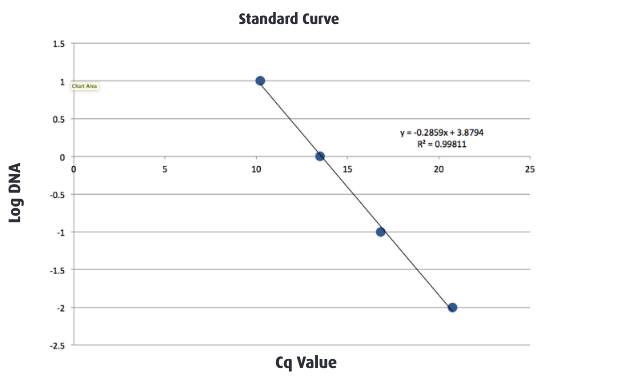
In quantitative PCR (qPCR), a standard curve is often created by preparing serial dilutions of a known DNA sample. Each dilution has a specific concentration, and the qPCR machine measures the fluorescence emitted as the DNA amplifies. By plotting these known concentrations against the fluorescence signals, a standard curve is established, allowing researchers to determine the concentration of DNA in unknown samples by comparing their fluorescence values to this curve.
How Do You Create a Standard Curve?
Methods will vary slightly depending on the particular technology. For instance, you can check out our standard curve guide for DNA fragment sizing here. But they generally follow the following steps:
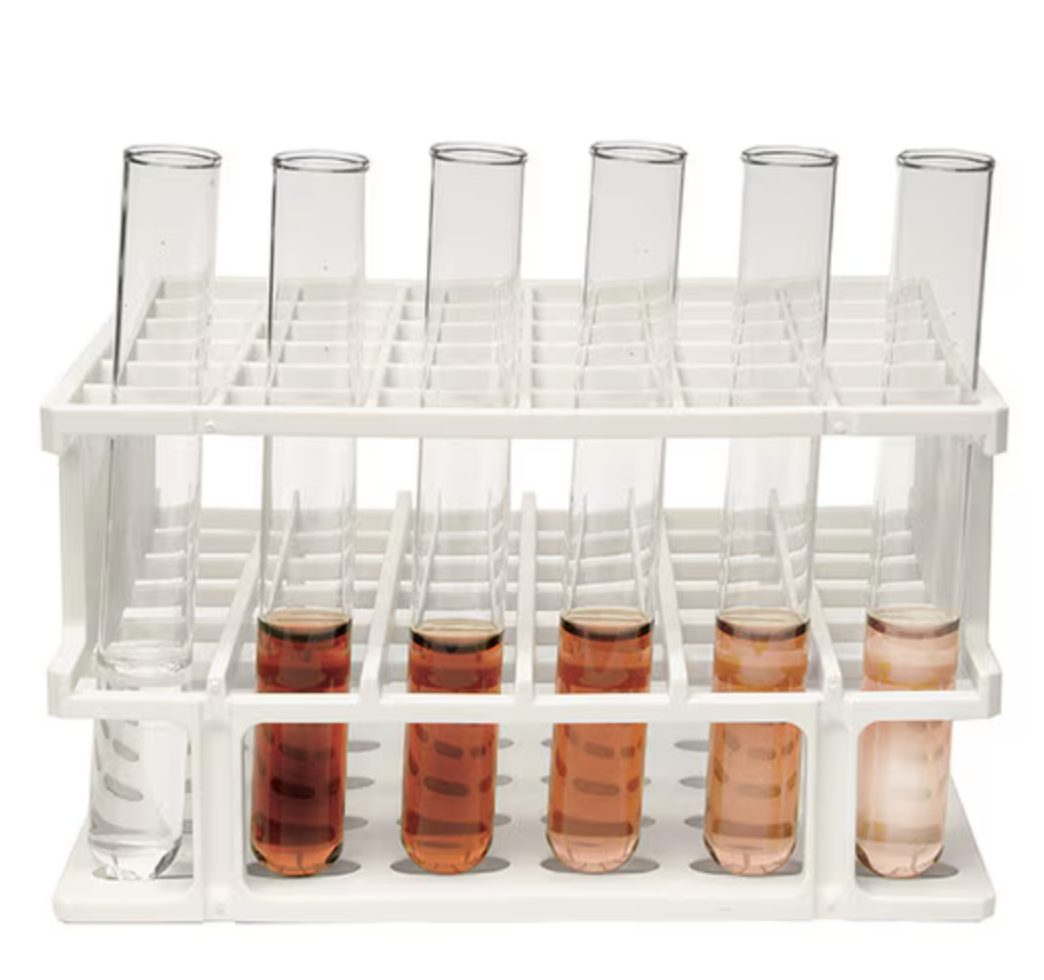
- Prepare Standards: Make a series of standards with known concentrations of the substance you’re measuring. Often, this is done by creating serial dilutions. Serial dilutions are made by progressively diluting a stock solution in a consistent ratio (e.g., mixing 1 part solution with 1 part solvent for a 1:2 dilution, mixing 1 part of that solution with 1 part solvent for a 1:4 dilution, and repeating for 1:8, 1:16, etc.).
- Measure Response: For each standard, measure the response (e.g., absorbance, fluorescence, or another signal) using an instrument appropriate for your assay.
- Plot Data: Plot the known concentrations on the x-axis and the measured response on the y-axis. Each point on the graph represents a standard.
- Fit the Curve: Use software or graphing tools to fit a line or curve to your data points. Ideally, this will be a straight line, showing a direct relationship between concentration and response. This line of best fit often has an equation (e.g., y = mx + b). However, not all relationships are linear. In these cases a line can be created by putting one or both set of axes on a logarithmic scale. Alternatively, the relationship can be described by a more complex mathematical models that fits the data.
- Verify Curve Quality: Check that your curve fits the data well. A high R-squared value (close to 1.0) suggests a good fit. This ensures your curve is reliable for estimating unknowns.
- Use the Curve: To find the concentration of unknown samples, measure their response, and use the standard curve equation to calculate their concentrations based on their position along the curve.
What are Some Common Challenges of Making A Standard Curve?
Creating a high-quality standard curve may seem straightforward, but it often requires practice, precision, and a good dose of patience. Small pipetting errors, for instance, can lead to inconsistencies in concentration, which may distort the curve, especially at lower concentrations. Another common hurdle is a nonlinear response, which can arise if the signal is no longer proportional to concentration—sometimes due to limitations in the instrument or reagent saturation. Standard stability can also be an issue; for example, DNA or protein standards can degrade over time, so fresh standards are often necessary to maintain accuracy.
In What Kinds of Labs Would I Encounter Standard Curves?
Standard curves are found in many labs, from molecular biology to pharmacology, environmental science, and beyond. For example, in addition to colorimetric protein assays and quantitative PCR, they’re key in ELISA for quantifying proteins and antibodies, in electrophoresis for determining DNA fragment sizes, and in liquid chromatography for measuring compounds in complex mixtures. They’re also used in mass spectrometry to track small molecules and proteins. In pharmacology, standard curves help create dose-response curves that allow scientists to figure out how potent a drug is. In CRISPR experiments, researchers use them to check how successful their gene edits are by comparing the amounts of edited and non-edited DNA. And in environmental science, standard curves are vital for monitoring pollutants, like measuring microbial or chemical concentrations in water, to assess environmental health.
How Can Creating and Analyzing Standard Curves in the Lab Help Students?
Creating and analyzing standard curves in the lab integrates mathematical concepts into biology, enhancing students’ quantitative skills. By plotting concentration data and fitting curves, they practice essential skills like graphing, understanding linear relationships, and interpreting trends. Working with standard curves also promotes problem-solving. Many classes enjoy the activity of a “mystery sample challenge,” where students use a standard curve to determine the concentration of an unknown substance. Another approach is to make real-world scenarios, like water quality testing or drug discovery, more realistic by having students not only perform the experiment but also interpret the data and make concrete recommendations—such as deciding whether to close a beach or determining the proper drug dosage. While standard curves might not have the most glamorous name, they are far from ordinary when it comes to both science and learning.

1 comment
Comments are closed.