

Agarose gel electrophoresis separates biomolecules, such as DNA and proteins, into discrete bands each comprised of the same sized molecules. By separating these important molecules by size scientists can isolate, identify and/or analyze them. [For a fun and fast 101 on electrophoresis check out the Amoeba sister’s video and for a deeper dive – and to see a real electrophoresis experiment in action – view our recent live stream episode.]
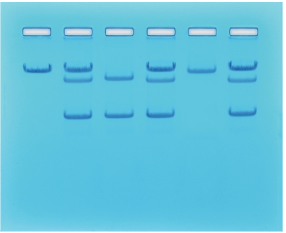
Often the results from an electrophoresis experiment can be analyzed by directly comparing the bands produced by an experiment’s samples to those produced by several controls. For example, in the gel below the first three lanes are controls that show the DNA banding patterns produced when a person has sickle cell disease (lane 1), is a carrier with a single sickle-cell gene (lane 2), and is healthy and has two normal genes (lane 3). In this case, determining the genotype of the three patients on the left (lanes 4, 5, and 6) at the sickle cell gene can be accomplished by matching the banding pattern of their DNA to one of the controls.
However, at other times the actual length of a fragment is needed. Because the building blocks of DNA are nucleotides, DNA is measured in nucleotide base pairs or bp for short. Knowing the bp length of a DNA fragment can be essential when working with repetitive DNA regions like microsatellites, when constructing recombinant DNA plasmids, or when collecting information for large databases. In many cases, length can also provide added evolutionary information.
To determine a DNA molecule’s base pair length a particular type of control is needed called a DNA Standard Marker or sometimes a DNA Ladder. This is a sample that contains a mixture of DNA fragments whose lengths are already known. These fragments are used to create a standard curve that describes the relationship between DNA size and distance traveled during an experiment. The equation derived from this curve can then be used to calculate the length of any unknown fragments based on how far these fragments traveled during the same experiment.
What’s log got to do with it?
Larger molecules travel slowly through an agarose gel while smaller molecules travel quickly. This means that the migrate rate of a fragment is inversely proportional to the length of the molecule.

DNA Ladder with larger / slower moving fragments near the top and smaller / faster moving fragments near the bottom.
However, this relationship is not linear. Rather as fragments get smaller they move faster and faster and as they get larger they move slower and slower. For example, in the DNA ladder above the base pair difference between the top two fragments is 328 bp while the difference between the bottom two fragments is 200 bp. Yet there is more distance between the bottom two fragments because these smaller fragments traveled much faster through the gel.
You can observe this inverse but non-linear when you create a graph of known fragment lengths versus distance traveled as I’ve done below for Edvotek’s Standard Marker (a picture of the this ladder is at the end of the post). In this graph the distances each fragment traveled are on the x-axis and the bp lengths of the fragments are on the y-axis. This graph was created in a spreadsheet as was the equation that’s displayed in the right-hand corner.

Another way to plot this information is in a log graph which is shown below. Like the first graph the distances each fragment traveled are on the x-axis and the bp length of the fragments are on the y-axis. However, unlike the previous graph, the y-axis is on a log scale. Even though these two graphs look different they use the same data and describe the same relationship. A log scale graph is simply a tool we can use to see the information differently. Importantly, a log scale graph is also much easier to create and use if you need to calculate bp lengths by hand because its easier to draw and calculate the slope when the graph’s trendline is a straight line.

Sometimes logs can trip us up. But they are really just a way to write exponential equations so that the exponent is isolated on one side of the equation – e.g. 23 = 8 can be written as log2 8 = 3. In fact, logs were invented to make life easier for scientists working with very large numbers. The method was originally developed in the early 1600s by John Napier and gained popularity among scientists of the day because it helped them to more accurately and easily calculate planetary orbits. Today, logs are still used as a way to effectively describe datasets where there is a large range of number values. Google uses logs to rank pages in its search engine and many economists use logs to describe countries economic growth rates. In electrophoresis, logs make nucleotide base pair measurements that can vary from 100 to 12,000 in the space of a few centimeters easier to graph and analyze.
Ready, set, run! (Then measure, graph, and calculate!)
Follow the steps below to discover the lengths of different DNA molecules. If you don’t have a gel on hand you can use the image at the bottom of this post to practice.
Step 0: Run a ladder in your gel. This sample will contain bands of known length which can be used to create a standard curve. Every experimental run of electrophoresis has its own unique set of conditions so every gel should have a ladder.
Step 1: Measure and record the distance traveled by each band in the ladder and record this distance in your notebook. Traditionally, this measurement is taken from the lower edge of the sample well to the lower edge of each band.
Step 2: Repeat step 1 for the fragments of the unknown samples.
Step 3: Generate a standard curve by plotting the data on a semi-log plot. (You can make semilog graph paper by going here and then printing page 16.) To create a standard curve on the semi-log paper, plot the distance each Standard Marker DNA fragment migrated on the x-axis (in mm) versus its size on the y-axis (in base pairs). Be sure to label the axes! After all the points have been plotted, use a ruler or a straight edge to draw the best straight line possible through the points. The line should have a similar number of points on each side of the line. It’s okay if the line runs through some points.

Step 4: Determine the length of each unknown fragment. First, locate the migration distance of the unknown fragment on the x-axis of the graph paper. Next, draw a vertical line from this point until it intersects the line of your standard curve. Finally, from this point of intersection draw a second line, this time horizontally, towards the y-axis. The value at which this line intersects the y-axis represents the approximate size of the fragment in base pairs.
This is just one way of doing this. There are many different approaches you can use. For instance, steps 3 and 4 can be done in excel or a similar spreadsheet software by using the program’s graphing and trendline functions and then plugging the step 2 measurements into the resulting equation. Another opinion (if you have a ladder with <6 bands) is to go here and simply enter in the distance measurements (the same calculations are being done just behind the scenes). Finally, the free software program Gene Analyze or the popular school data program Logger Pro can be used to complete all 5 steps.

Happy molecule measuring!

6 comments
Comments are closed.