

We’re back with another article about data analysis! For our previous blog post: Data analysis: range, mean, median, and mode

Now, as we remember, data is only as good as the measurements made to collect them! When making measurements, it is important to use tools that are both accurate and precise. This allows us to minimize the amount of experimental error in the experiment. We can define “experimental error” as the difference between the results we expect, and the results we observe experimentally. For example, if we measure the wrong percentage of agarose powder when making a gel, our results will look different than we expect. (For more information on this, check out our previous blog post on gel percentages.)
There are two types of errors that can be made when making measurements: random or systematic. Random errors are just that – unpredictable and impossible to avoid. Generally, the random error is caused by the equipment doing the measuring: the balance, the micropipette, etc. They are just as likely to be too big as they are too small. Often times, when making multiple measurements, these will cancel one another out so our overall measurement is pretty close to the target. Systematic errors, on the other hand, can be traced back to a specific way an experiment was performed. The user may not be reading the measuring instrument correctly, or the calibration was performed wrong, or the researcher may be using poor technique. These errors are generally consistent and reproducible between measurements. With training, the researcher can improve their accuracy with a specific measurement and reduce the errors.
So, how do we know whether there is error in our measurements? We can calculate the average of our data (discussed in our previous post) and then determine the average amount of variation in our experiments by calculating the standard deviation. This value can tell us how far away from the expected value we can expect our measurements to be. By the “magic” of statistics, we expect a little more than 68% of our data to fall within one standard deviation of the mean, and about 95% of the data to fall within two standard deviations.
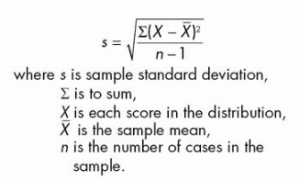
In general, we need three or more measurements to calculate the standard deviation. The numbers are plugged into the equation (seen here at right) or, more simply, analyzed using an Excel document and the equation “=STDEV(first cell:last cell)” to calculate the standard deviation. (I’ve performed this calculation in the bluegill document from last post if you are curious to see an example.). To further emphasize this calculation, and to have your students perform some hands-on measurements, try the below activity.
Students will need a lab notebook, an analytical balance, a graduated cylinder, large volumetric transfer pipettes (25 mL) and pipette pumps, water, and a 50-mL flask or beaker. Before beginning the experiment, have students examine the graduated cylinder and the transfer pipette and hypothesize which will be more accurate and precise. Teach proper measurement techniques for both measuring devices ahead of the lesson.

- Place the beaker/flask on the analytical balance and press the tare button. This resets the balance to zero, cancelling out the mass of the vessel.
- Using a graduated cylinder, measure 20 mL of water. Transfer the liquid into the vessel on the balance. Record the mass in your lab notebook.
- Empty the vessel and shake out excess water. (You can dry out the vessel between measurements if you wish, but you’ll be cancelling out the mass of the vessel and any residual water each time so it is not necessary).
- Repeat steps 1-3 at least two more times. The more data you collect, the better your calculations will be.
- Next, repeat the measurement steps (1-4), but instead of using a graduated cylinder, use a transfer pipette.
- Compare the averages and the standard deviations from the graduated cylinder vs the volumetric pipette. Which measurement tool had a smaller standard deviation? What does this mean for your experiments? With training, could the standard deviation be reduced?

1 comment
Comments are closed.